Meta-analysis - tSNE
Data preparation
- Started with outliers-removed data
- Data were merged into a single matrix (350 x 22939)
- Genes with nans were removed (350 x 11521)
- Matrix was standardized to have unit mean and variance
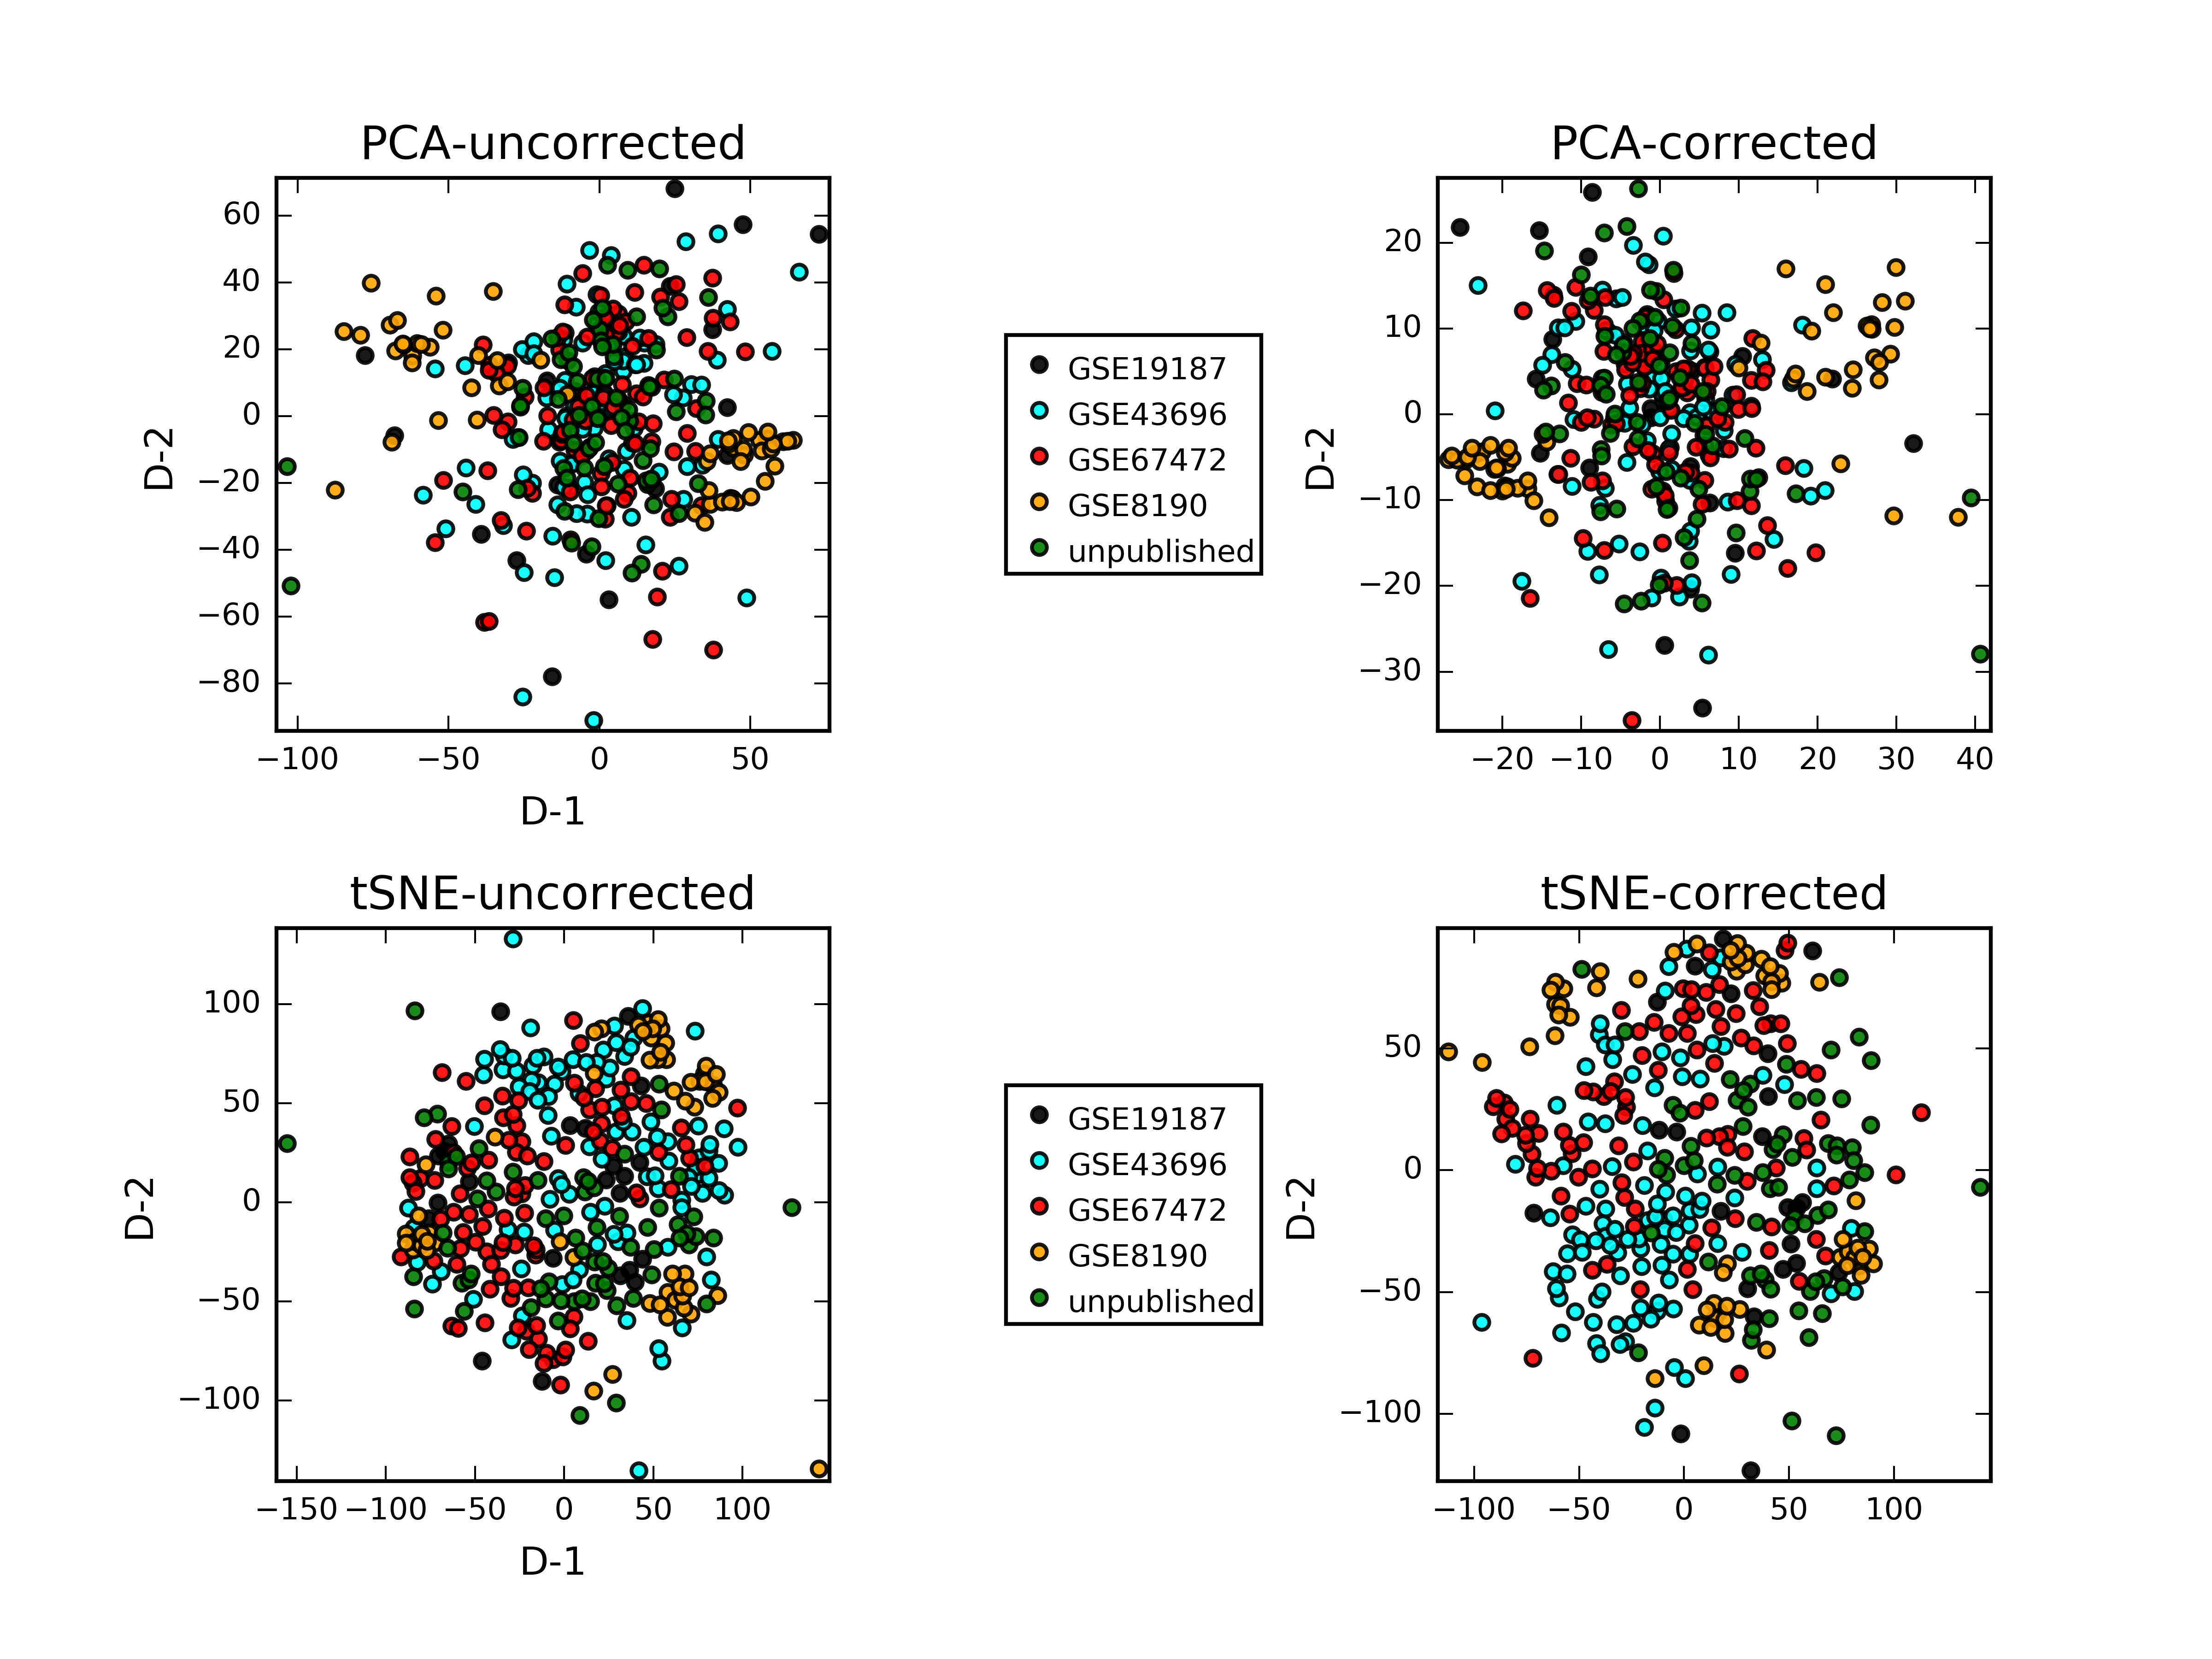
- Batch effects were corrected for using ComBat (study,gender)
To visualize the effects of batch correction the following figure has both corrected and uncorrected projections. PCA, although distinct from tSNE is used to visualize high-dimensional data so it is included here.
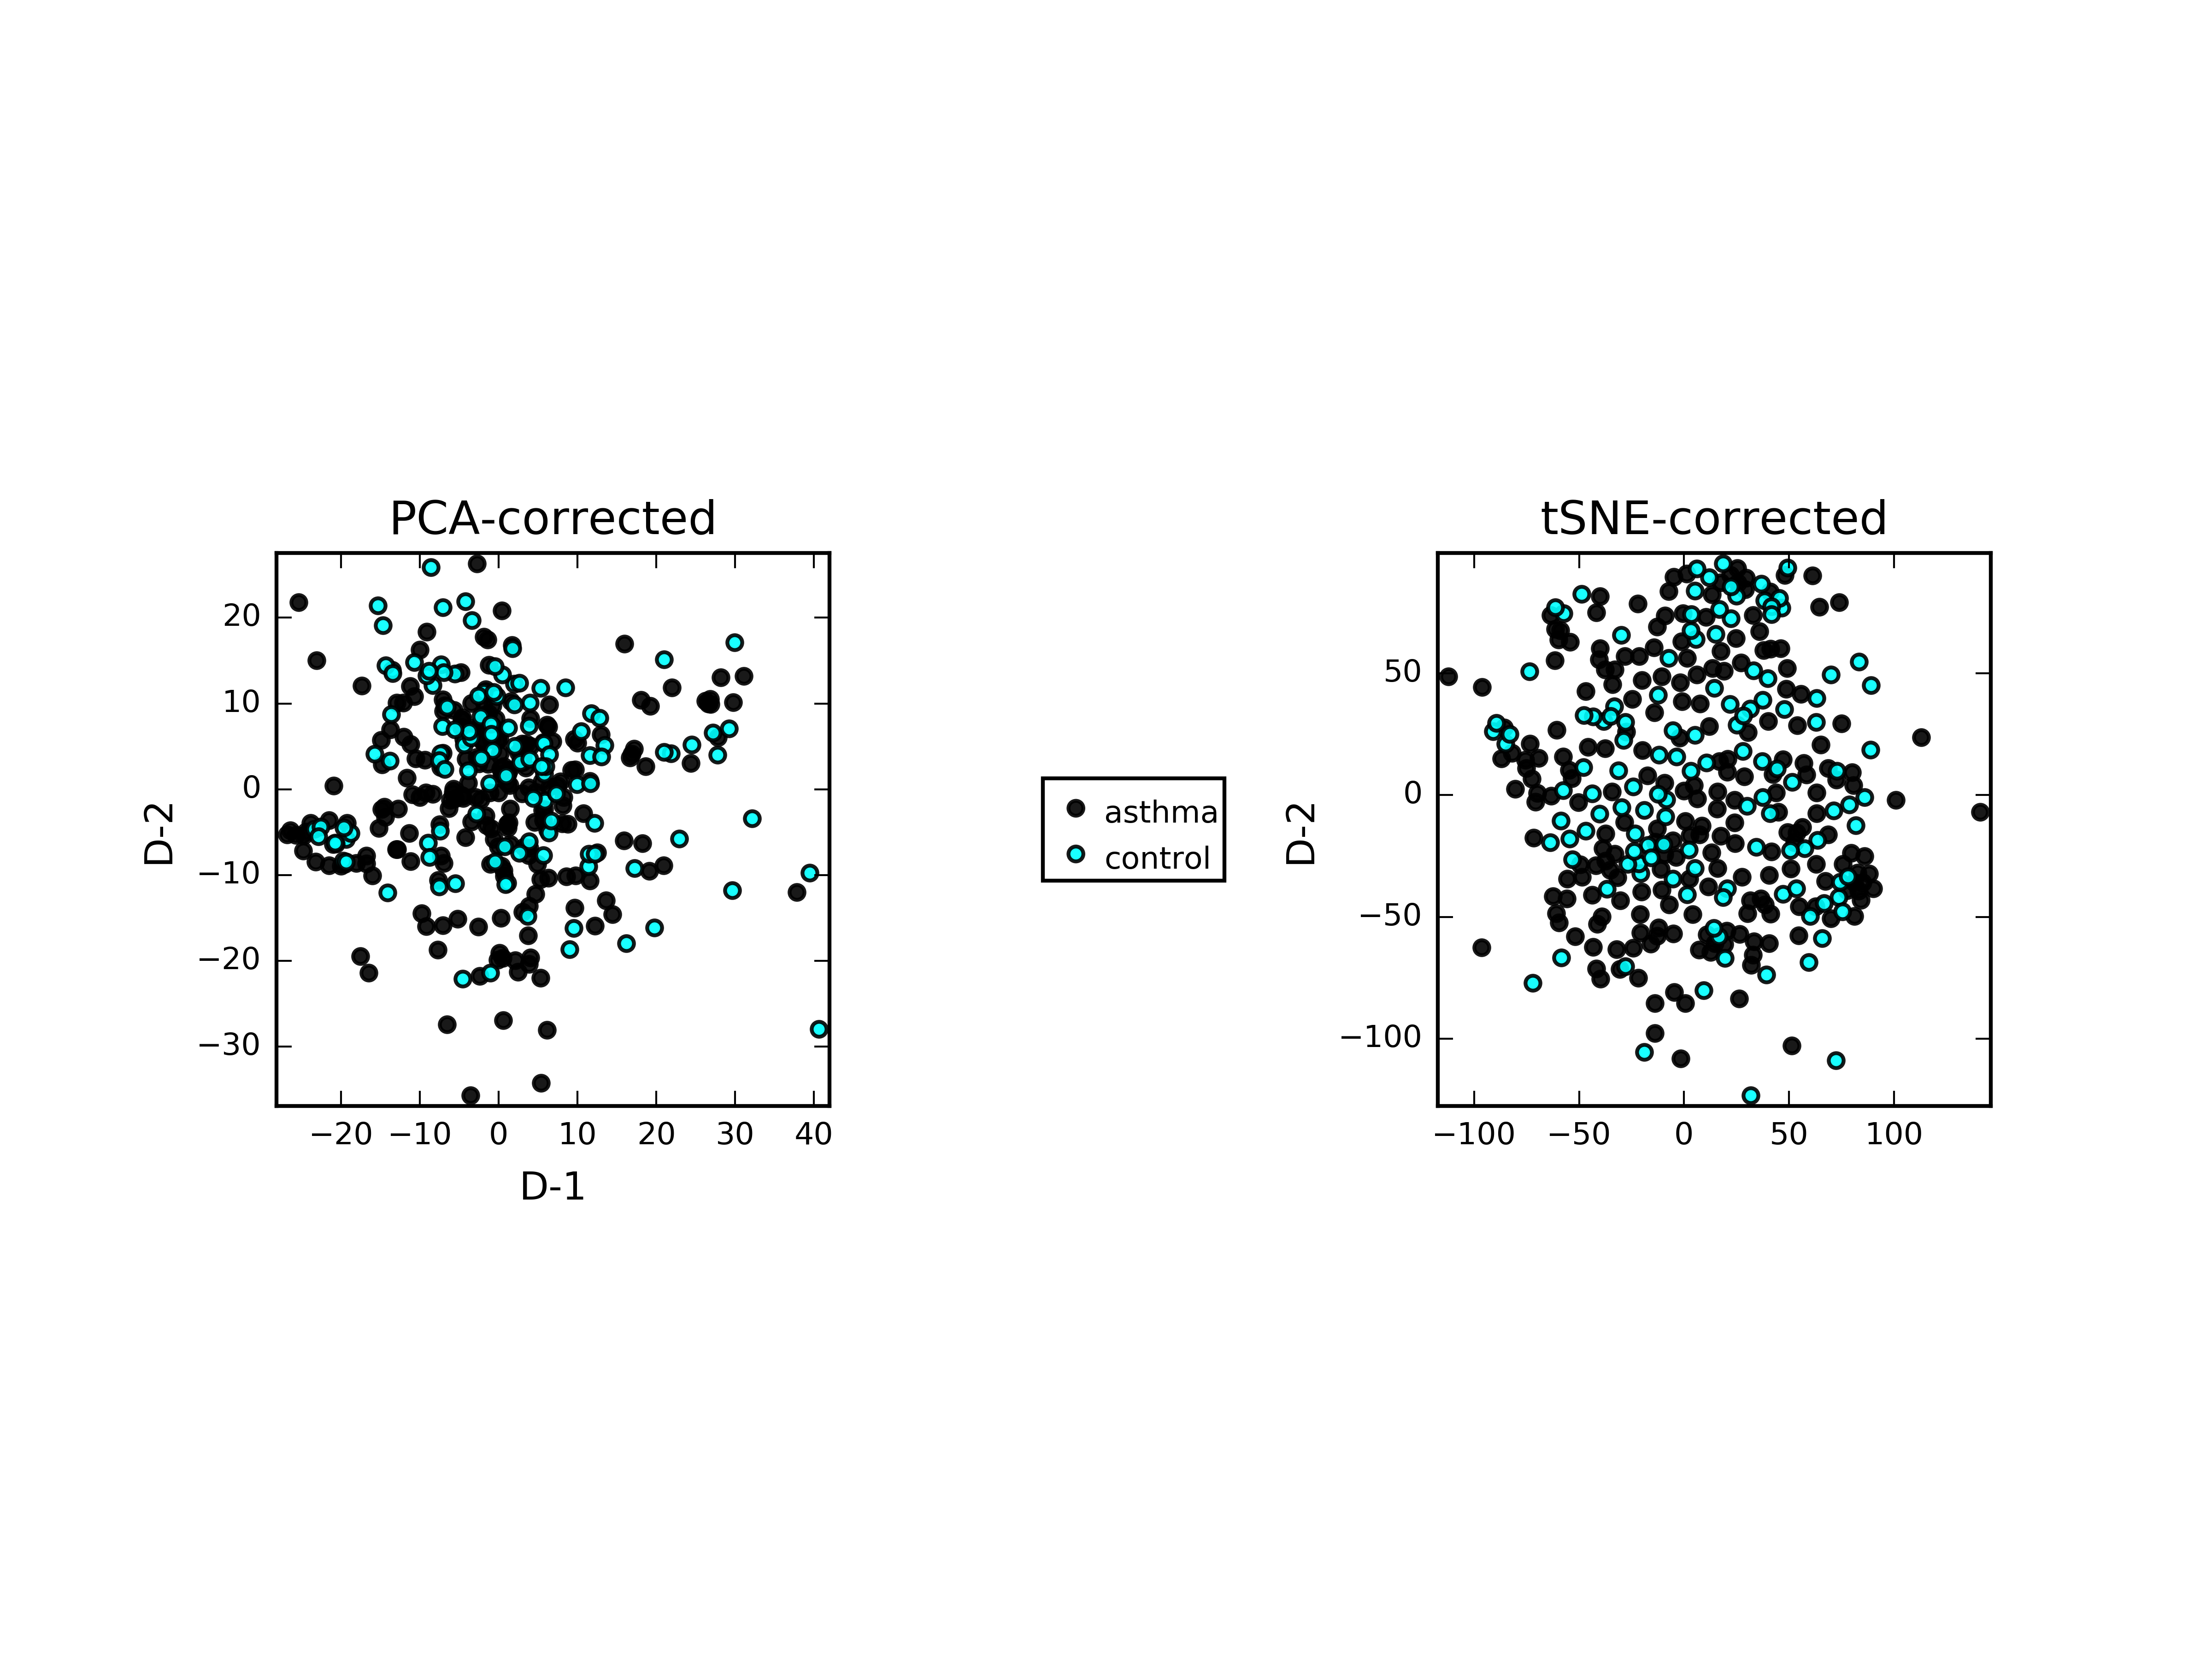
The corrected panels from the previous figure are colored according to phenotype in the next figure.
The controls were then excluded from the matrix and both tSNE as well as PCA were re-run.
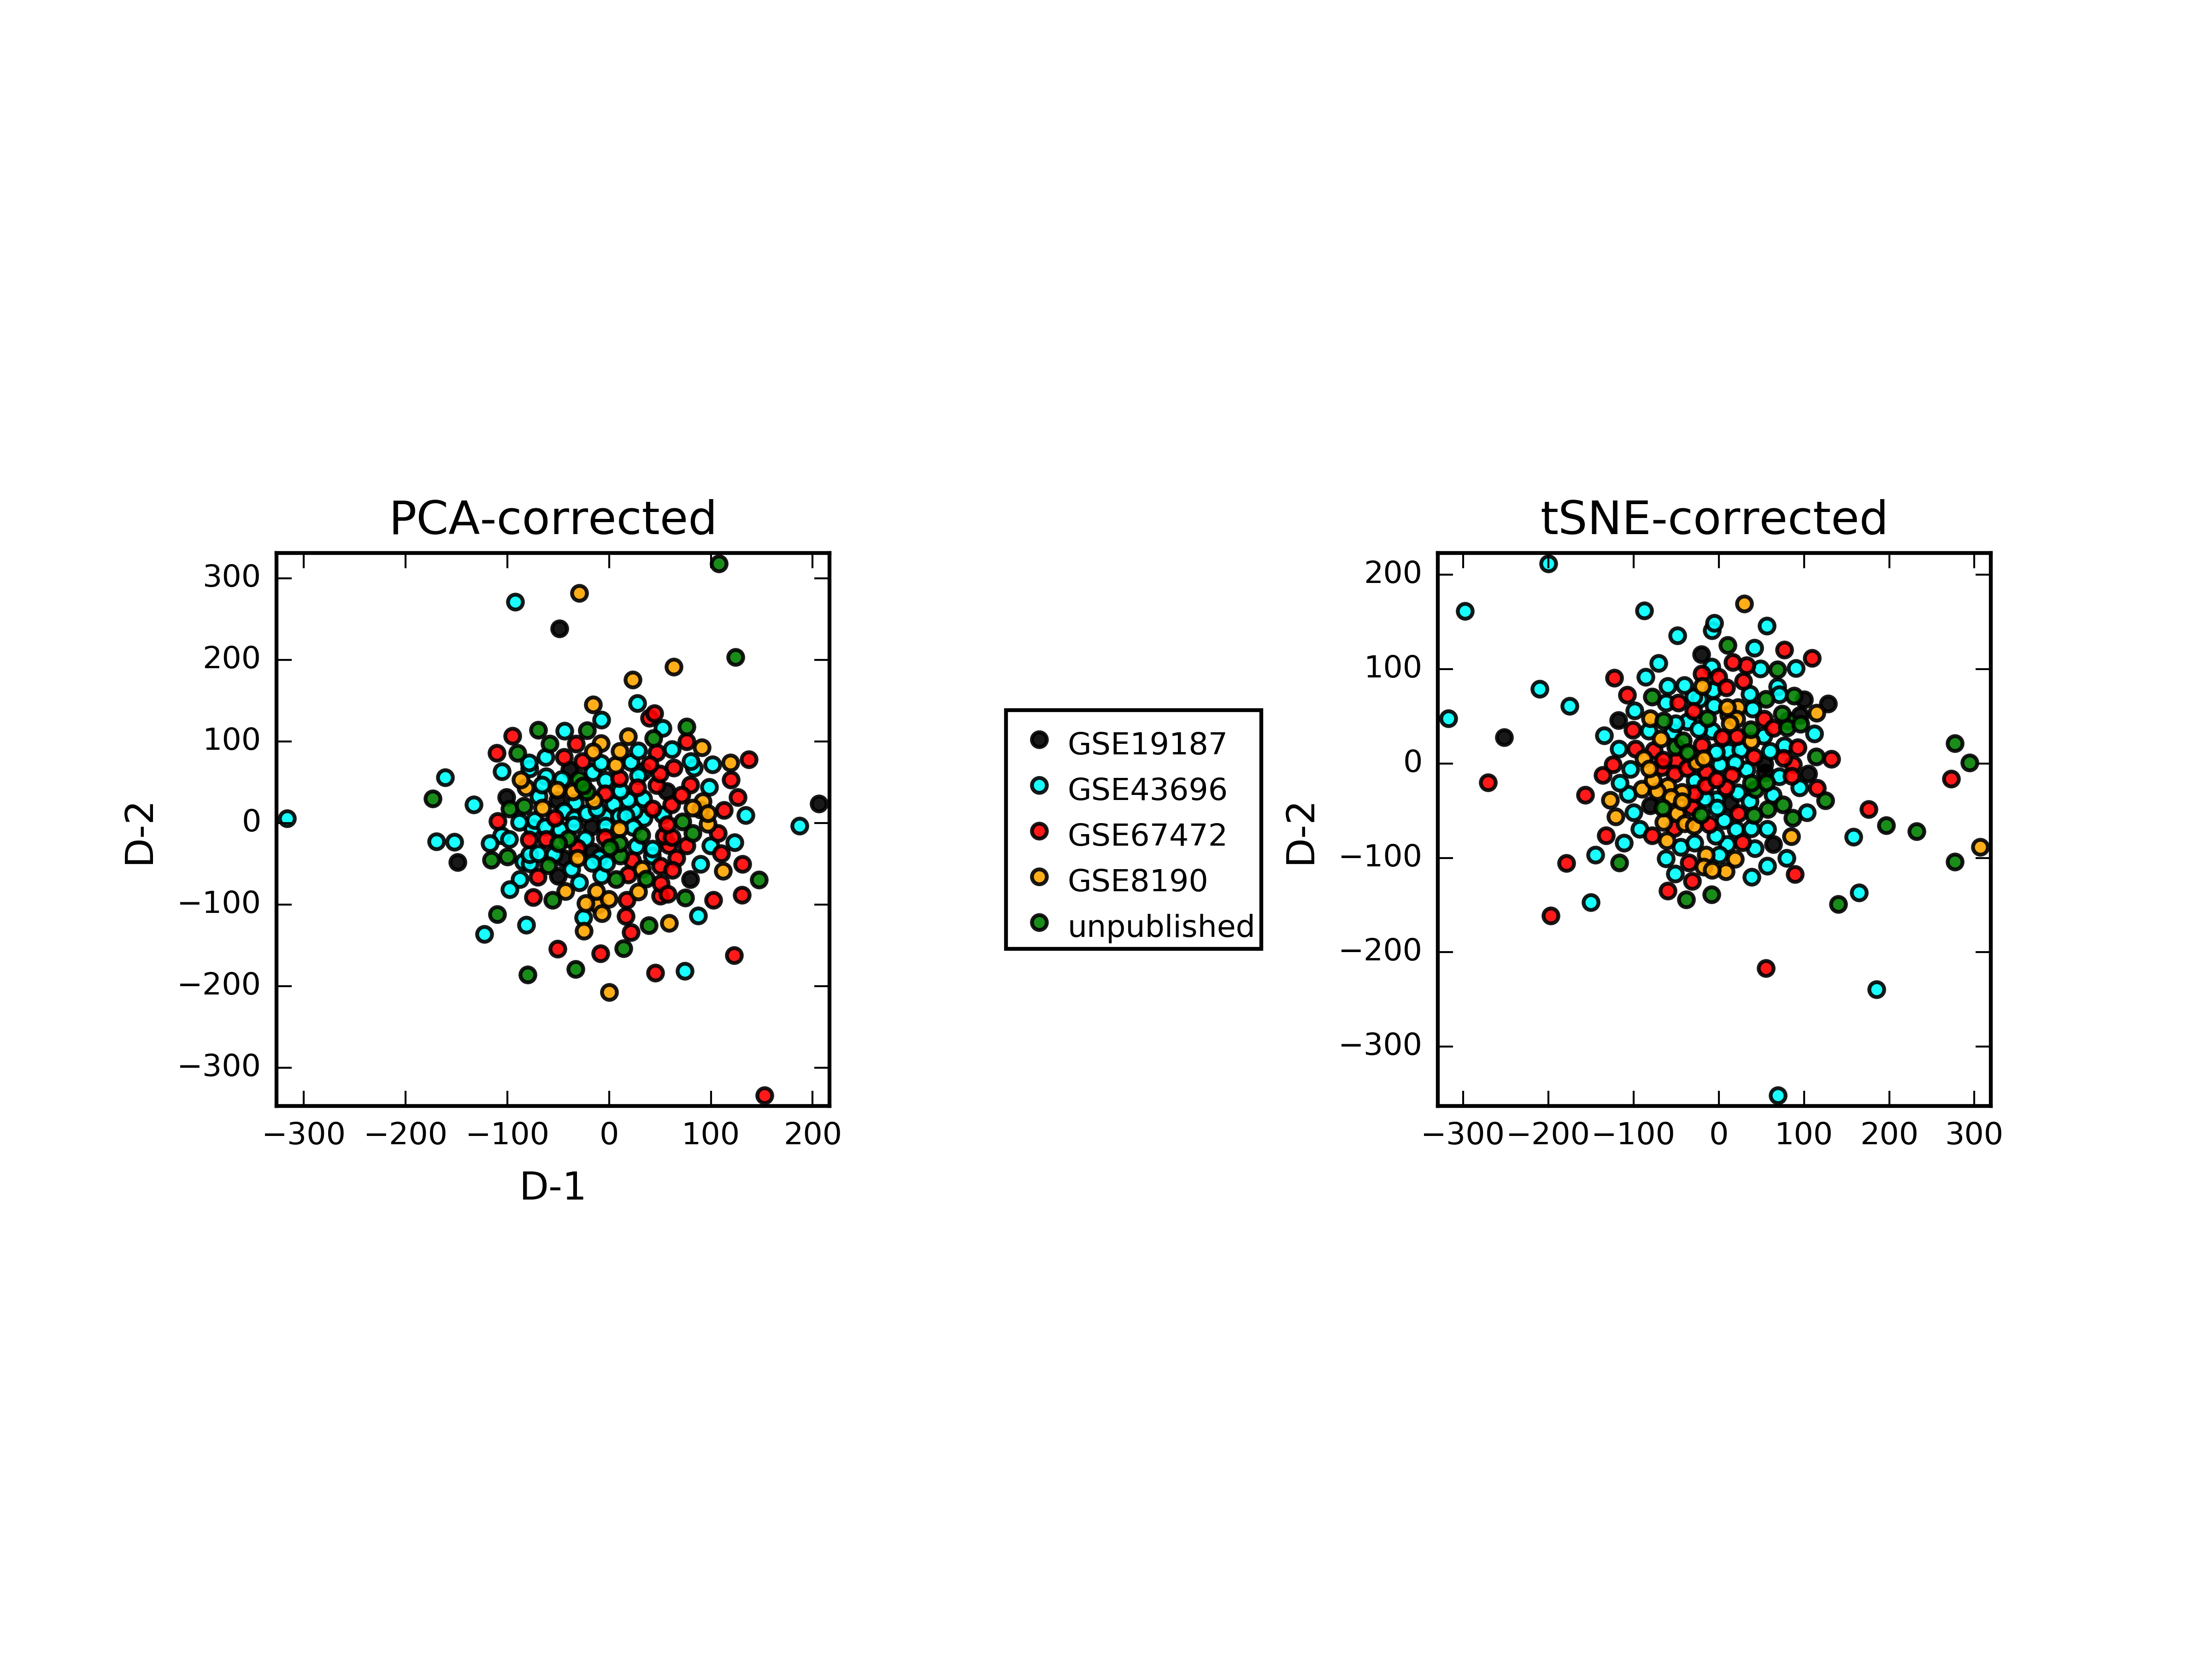
Given the labeling we have for cases and controls we observe that the cases are tightly clustered and no subtypes are readily distinguishable.